


Blog / Thomas Kemper / March 19, 2020
By Thomas Kemper, GHSL project lead, Disaster Risk Management Unit at the European Commission Joint Research Centre. This post has been adapted from the World Bank Blog, Sustainable Cities by Lewis Dijkstra, Ellen Hamilton, Somik Lall, Sameh Wahba. Read the original post here.
Earlier this month, the UN Statistical Commission endorsed a new method for classifying and defining cities. The Degree of Urbanization is now a globally recommended method for international comparisons of the built-up environment. A coalition of six international organizations including ILO, FAO, OECD, UN-Habitat and World Bank submitted this new global definition of cities, towns, and rural areas.
The GEO Human Planet Initiative (HPI) has been supporting this work using open satellite data and global spatial information to help produce methods to classify cities and rural areas. Working with the European Commission’s Joint Research Centre (JRC), together with the Group on Earth Observations (GEO), HPI has worked with a wide network of researchers from around the world to develop and define the Degree of Urbanization with openly available data and tools.
This includes key resources and visualisation tools for the Degree of Urbanization, and Country Fact Sheets from population source data. This data is collected by the Center for International Earth Science Information Network (CIESIN) mostly from the national statistical offices and the built-up areas detected by the European Commission's JRC using the Global Human Settlement Layer method on satellite imagery from Landsat.
GEO advocates for open access to Earth observation data. This includes our work with partners to build the Global Human Settlement Layer Population Grid, a free and open data tool to measure population and with POPGRID, a data collaborative that provides freely accessible settlement data for the international community.
READ MORE: Open Earth observations for sustainable urban development
Building international agreement on the Degree of Urbanization was key, as the World Bank notes: “Because national definitions of urban and rural areas differ significantly from one country to another, it is difficult to compare these areas across national borders. If we can’t compare the performance of urban or rural areas across national borders, then we can’t learn from policies used in other countries. It also means we cannot meaningfully compare the United Nations (UN) Sustainable Development Goals' (SDGs) indicators for urban and rural areas across countries.
Many countries use a minimum population size to define an urban area, but that size can be 200 (as in Denmark), 2,000 (Argentina), 5,000 (India) or 50,000 (Japan) or even 100,000 (China). Some countries don’t use a statistical definition but designate urban areas by administrative decision. In other countries, the sectoral employment or provision of infrastructure and services is used to determine whether settlements should be classified as urban or rural.
Finally, once categorized as urban or rural, places are rarely recategorized. Some of this resistance may come from the allocation of fiscal transfers – consider India, where getting reclassified as urban may cause places to lose government transfers, or Egypt, where getting reclassified as urban would trigger additional public investment for higher-level service delivery requirements, including police stations and courthouses.”
As the World Bank outlines, they needed a wide-angle view to facilitate comparability across countries: “By introducing an objective and data-driven approach to measuring poverty and applying this approach globally, the Degree of Urbanization seeks to do for the definition of urban what the $1/day poverty line did for poverty measurement in the 1990s.
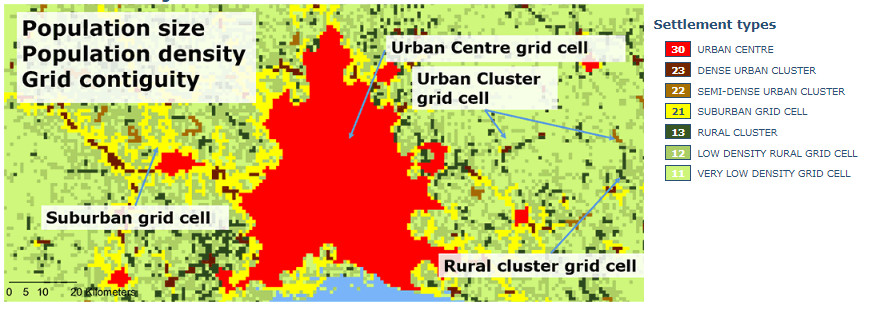
The Degree of Urbanization identifies three types of settlements:
This new approach offers several advantages:
Simplicity and transparency. It relies on the simple combination of population size and density applied to the population grid, instead of a multitude of criteria or complex and lengthy calculations. An increasing number of countries have their own population grid. Several global population grids have been estimated and are available for free, including the Global Human Settlement Layer Population Grid (GHS-POP). The estimated Degree of Urbanization for each country in the world using GHS-POP can be found here.
Driven by population size and density. Population size is used by more than half of the national definitions of urban and rural areas. The thresholds used in the Degree of Urbanization take inspiration from these national definitions. However, it uses two thresholds instead of one. For cities, it uses 50,000 inhabitants as Japan does. For towns and semi-dense areas, it uses 5,000. Out of the 100 countries that use population size threshold, 85 use the 5,000 threshold or a lower threshold. The thresholds used in the Degree of Urbanization were also tested to ensure that they produce a valid and robust classification and a balanced population distribution across the three classes.

It helps monitor progress on the SDGs. The SDGs include a multitude of indicators that should be collected for cities, urban, and rural areas, including access to electricity, water, the Internet, and all-weather roads. Some definitions of urban areas, however, include access to water and electricity. This makes it impossible to monitor these services in urban areas because it becomes a circular argument. All urban areas have water because by definition they can only be urban if they have access to water. For example, the definitions used by Bangladesh, Cuba, and Panama all include access to drinking water. Because the Degree of Urbanization does not include services or infrastructure, it can monitor these services in an unbiased manner.
It captures agglomeration economies. Because the definition relies on the spatial concentration of the population, it captures the logic of agglomeration economies. The cost of service provision tends to increase from cities to towns and semi-dense areas and then to rural areas. As a result, access to these services tends to be highest in cities and lowest in rural areas. For example, access to the Internet and having a bank account both follow a clear urban gradient in all four country income groups.
Cost-effective monitoring. The Degree of Urbanization can be used to re-aggregate existing data. For example, if a statistical office has measured local employment rates, then it can calculate employment rates by Degree of Urbanization. Geo-coded micro data can also be aggregated. This was done for the Gallup World Poll in 115 countries and for the Demographic and Health Survey in 41 countries in a new report by Vernon Henderson et al. This allowed us to show that access to safely managed drinking water is higher in cities, second highest in towns and semi-dense areas, and lowest in rural areas (Figure 3) in almost all of the countries covered by this survey.”
For more information, visit this page for key resources, information, visualisation and Country Fact Sheets on the Degree of Urbanization.
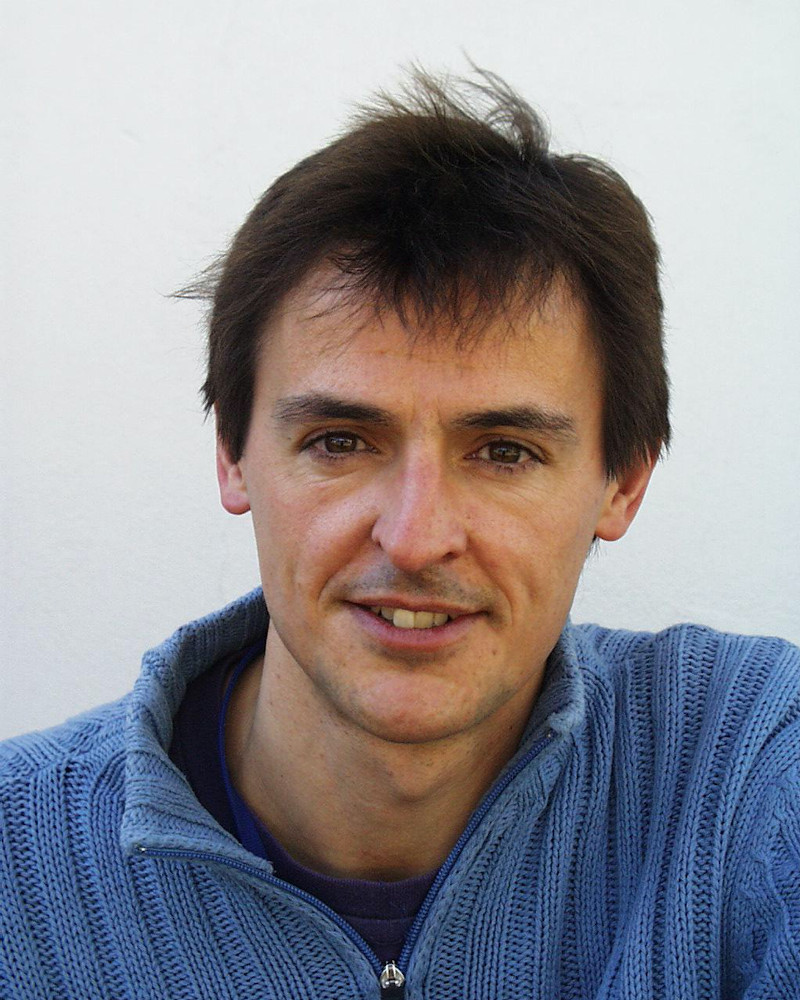
Thomas Kemper, Ph.D. Since January 2017 has been leading the GHSL project in the Disaster Risk Management Unit at the European Commission Joint Research Centre. He has a wide experience in remote sensing both with satellite and airborne sensors and uses this for the detection and characterization of settlements in support of EU policies related to civilian crisis management and development, in particular the Sustainable Development Goals.
Thomas received the Ph.D. degree in geosciences from the University of Trier (Germany) in 2003 for mapping heavy metals in soils. From 2004 to 2007, he worked with the German Aerospace Center (DLR), Oberpfaffenhofen, Germany, where he helped in setting up the Center for Satellite-Based Crisis Information (ZKI), which provides rapid mapping information after natural disasters. Since 2007, he is working on the analysis of human settlements, in particular informal settlements such as slums and IDP/refugee dwellings.
Follow us on:


